
What Constitutes a Market Correction?
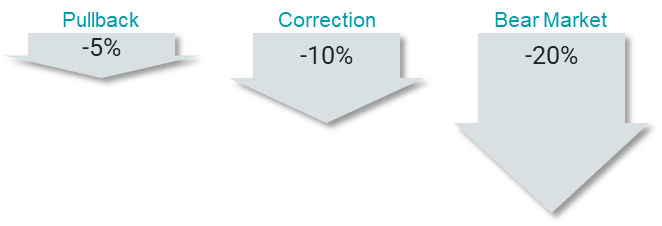
You have likely read about various return thresholds with accompanying labels. A return of -5% from a previous high is technically a “pullback”; -10% is “correction territory”; and -20% is a “bear market.”
In Figure 1, we show the number of times the market has fallen at least 2.5%, 5%, 10% and 20% from previous peaks, along with the median length of time before it recovered (got back to its previous high).
For example, from July 1926 through the end of 2021, the market declined at least 10% from its previous high 29 times, or a little more often than once every four years. The median drop among this sample was -20.1%, and the median length of time it took for the market to return to its previous high was 194 trading days. Drops of at least 5% occurred 90 times, or a little less frequently than once per year over the sample period.
When looking at this data, the main observation is that declines happen fairly frequently, and in many cases, markets have recovered reasonably quickly. Significant declines are not extremely rare events. Normal times include market declines and periods of higher anxiety.
Figure 1 - Market Declines Are Normal | ||||
DECLINE OF AT LEAST | ||||
2.5% | 5% | 10% | 20% | |
NUMBER OF DECLINES | 180 | 90 | 29 | 15 |
MEDIAN DECLINE FROM PEAK TO BOTTOM | -5.0% | -8.7% | -20.1% | -28.2% |
MEDIAN RECOVERY TIME IN TRADING DAYS | 33 | 62 | 194 | 369 |
Data from July 1926 – December 2021. The market is represented by the CRSP U.S. Total Market Index. Note: Each decline bucket includes the more severe drops. For example, all fifteen 20% declines are included in the other three buckets. Source: Avantis Investors. Past performance is no guarantee of future results. | ||||
Sometimes averages and even medians don’t give us the full picture. It may be that no two market downturns are alike. We took a closer look at the 29 declines of at least 10% since 1926 and ranked them by the severity of the decline in Figure 2.
What stands out? First, the difference in magnitude among the declines is considerable. More than 20% of the declines in this category fall between -10% and -11%, and just about half of them fall between -10% and -20%. There is also significant dispersion in the length of the drawdowns and recoveries.
The bear market from early 2020 is likely still fresh in everyone’s mind. Markets fell quickly between late February and late March as investors worried about the impact of COVID-19, but the markets also rallied quickly, making up all lost ground in just 117 trading days.
Throughout history, there have been even faster recoveries and many slower ones. While easy to identify and plot in hindsight, attempting to predict when markets will “peak” or “bottom” is unlikely to be a fruitful endeavor.
Considering market drawdowns as part of normal times, something expected to happen from time to time, allows advisors to create portfolios that may withstand these events and prepare their clients to deal with the anxiety they cause.
Luckily, long-term investors may be able to view these events through an alternate lens. Figure 3 plots the cumulative growth of $1 invested in the U.S. stock market from 1926 to 2021. The vertical lines in the chart depict the market bottoms associated with pullbacks (5%) and corrections (10%). While it is doubtful any of them were pleasant when they happened, investors who stayed the course and remained invested were likely better off for having done so. A dollar invested in July 1926 would have grown to more than $11,614 by the end of 2021!
We can also look at recent history to provide additional context if the period in Figure 3 seems too abstract. The CRSP U.S. Total Market Index returned 16.3% per year over the last 10 years, a period in which there were 14 drawdowns of at least 5% (four of those were drawdowns greater than 10%).
The bottom line? Downturns and volatility are part of investing, just as winds and waves are part of being at sea. As investors, we can’t control markets, but we can control how we set up our portfolios and how we react. As much as ever before, we believe preparing for the waves and riding out these storms is still the best course of action.
Data from July 1926 – December 2021. The market is represented by the CRSP U.S. Total Market Index. Source: Avantis Investors. Past performance is no guarantee of future results.
SOURCE: Avantis Investors.
There
is no guarantee investment strategies will be successful. Investing
involves risks, including possible loss of principal. There is always
the risk that an investor may lose money. A long-term investment
approach cannot guarantee a profit. Past performance is not a guarantee
of future results. Diversification does not eliminate the risk of market
loss. All expressions of opinion are subject to change. This
information is intended for educational purposes, and it is not to be
construed as an offer, solicitation, recommendation, or endorsement of
any particular security, products, or services.